By: Dylan Snyder
anak Jensen, NorSyamira bt Samsuri, Nurul Nabilah bt Abdul Rahim, Nur Syafiqah
bt Azman, Nur Shamila Aida bt Abdul Samari and Ainun Natasha bt Mohd
Nordin.
1.0 INTRODUCTION
According to Market Business News website, the term ‘economic base’ refers to companies and other employers that generate lots of jobs in a local or regional area. They also bring in income from outside the local area. These employers are usually companies but may also include the government and civil service departments. Economic activities are grouped on the basis activities and the non-basic activities. Export activities are all activities produce products or service providers who bring in money from outside the region called base activities.
This sector plays a very important role on viewing the current economic condition in Pekan Kuah, Langkawi, Kedah. It is to study in terms of commercial, industrial and tourism. In collecting data, major and supporting economic activities were identified in Pekan Kuah, Langkawi that contribute to the economy. Most of them are the secondary data which need to be obtained from the related department and agencies such as Langkawi Development Authority (LADA), District Officer and Land Langkawi and Department of Statistics Malaysia (DOSM). During the site survey, questionnaires was also distributed at several areas to the residents, business or service entrepreneurs and tourists. The survey answers then will be used as the data for this sector to identify the potential area in Pekan Kuah, Langkawi. All these elements will determine the potential of economic development in Pekan Kuah, Langkawi for the future.
2.0 AIM
To determine the trends of economic output and economic growth development in terms of commercial, industrial and tourism in Pekan Kuah, Langkawi, Kedah
2.1 OBJECTIVES
- To identify the economic performance and trends of Kedah.
- To determine the activities in sector that contributes to the economy of Pekan Kuah, Langkawi.
- To determine how the tourism industries contributes to the economy of Pekan Kuan, Langkawi.
- To discuss the employment rate and labour forces at Pekan Kuah, Langkawi.
- To determine the household income of the population in Pekan Kuah, Langkawi.
3.0 METHODOLOGY
Primary data and Secondary data were used in the process of analysing the findings for this sector.
As for our primary data, 3 different types questionnaires were use throughout the analysis process, targeting 3 different demography; Residents, Commercial retail workers and Tourists. These questionnaires were distributed among potential respondents on site during the site visit period. A total of 203 responses were recorded for questionnaire on residents, 128 responses for questionnaire on commercial retail workers and 107 responses for tourists.
Meanwhile for the secondary data, we have received various data from the Department of Statistics Malaysia (DOSM) and Langkawi Development Authority (LADA), that aided us in the process of analysis.
4.0 EXISTING ECONOMIC CONDITION
4.1 Gross Domestic Product of Kedah
Gross domestic product (GDP) provides an economic snapshot of a country, used to estimate the size of an economy and growth rate. All the data will be collected from secondary sources will be analysis using trend analysis method to produce a projection of future economy.

Figure 4.1 - GDP per capita of Kedah
The data above is retrieved from the Department of Statistics Malaysia.
From the graph, we cam see that the GDP per capita for kedah is growing annually. In 2015, the GDP per capita was only at RM18,864 but it increased to RM19,835, RM20,960 and RM21,410 each subsequent year respectively.
With this growth, it was able to determine the Average Annual Growth rate is at 4.3%. At that rate, it is projected that the GDP per capita will reach up to RM26,360 by 2030.
4.2 Major Economic Contributor
Economic sector is one of the major contributions in the growth of Gross Domestic Product (GDP) in the state of Kedah. The economic sector consists of services, manufacturing, agriculture, construction and mining, and quarrying. Each economic sector plays an important role in ensuring the positive growth of economic in a region. Each region has its advantages. For instance, some regions have more agricultural production while others have more advantages in the manufacturing sector.

As for Kedah, the service sector is the major contribution in economic followed by manufacturing, agriculture, construction, and mining and quarrying as the Table 4.2 has shown.
The service sector spurred Kedah’s economic performance in 2016 with the value RM 22,604 million (54.9 percent), RM 23,797 million (53 percent) in 2017, and RM 25,092 million (5.4 percent) in 2018. The service sector shows a growth maintains the highest contribution compared to other sector.
In addition, manufacturing and agriculture are the second and third largest contributors for the state of economy in Kedah. Manufacturing sectors shows a maintains growth until 2018. The value-added RM 11,934 million (4.4 percent) in 2016, RM 12,449 million (14.5 percent) in 2017 and RM 12,826 million (3.0 percent) in 2018. It shows that manufacturing sectors growth respectively until 2018. While the agriculture sectors shows a positive growth until 2018. The value added for this sectors is RM 5,202 million (-4.1 percent) in 2016, RM 5,469 million (5.1 percent) in 2017 and RM 5,480 million (0.2 percent) in 2018.
The construction sector is the fourth contributor with value-added of RM 998 million (15.7 percent) in 2016, RM 928 million (-7.0 percent) in 2017, and RM 1,013 million (9.2 percent) in 2018. This sector shows a positive growth over the year. Mining and quarrying is the last contributor with value-added of RM 96 million (15.2 percent) in 2016, RM 110 million (14.5 percent) in 2017 and RM 114 million (3.9 percent) in 2018.
4.3 Tourism activity on supply and demand
The tourism sector is one of the most important sectors to generate economic growth of the country. This sector is able to drive growth various other sectors of the economy such as construction, transportation, hospitality, manufacturing, food, retail and other services. There are various tourism products offered in the island of Langkawi to local and international travellers. Such as, culture and heritage, theme parks, food and shopping travel products and so on. Tourism activity in this island city peak during specific seasons and events like Langkawi International Maritime & Aerospace Exhibition (LIMA), Le Tour de Langkawi and school holiday seasons.
Table 4.3 - Tourism Influx for Langkawi 2017-2019
 |
| Source: Department of Statistic Malaysia |

Langkawi has managed to attract about 3.5 Million visitors each year from 2017 to 2018. Based on data retrieved from questionnaire that was distributed especially for tourists, it was found determined that out of the 107 sample respondents, 24 of them have a travel budget of below RM1,000 meanwhile the rest would spend more. A handful of them also responded that their travel budget when visiting Langkawi would reach up to RM10,000 per trip.

To cater for the influx of annual visitors to Langkawi, Accommodation services such as hotel, resorts and homestay are always on the high demand. A survey was performed through a questionnaire targeted for tourists during the site visit period, asking the visitors regarding on which types of accommodation services do they prefer and the result are as shown in Table - .The table shows that Hotels are the most preferred by visitor where 17 out of 36 responded says so. This is followed by demand for Resort at 10 responses and homestay at 5 responses. The remaining responded said they prefer to stay at rental homes from apps such as AirB&B and some just preferred to stay in with relatives that they have in the island.

In addition to that, a question in the same questionnaire also asked the respondents to state what kind of attraction in Langkawi attracts them to visit the island. The results of the questionnaire are as shown in Graph -. The Graph shows that Eco tourism sector in Langkawi are highly favoured by the tourist and visitors of Langawi. This is followed by the Duty-free shopping experience, Adventure tourism and Historical Value respectively. Among other attractions that lure visitors into the island paradise is local Culture experience and local food hunting.
4.4 Labour forces & Employment rate


According to the table above obtained from the department of statistic Malaysia, it is found that the Number of Labour forces in kedah in increasing from 2015 to 2019. Initially at 905,300 in the year 2015 to 910,900 in 2016, 932,700 in 2017, 936,700 in year 2018 and finally 950,000 in 2019.
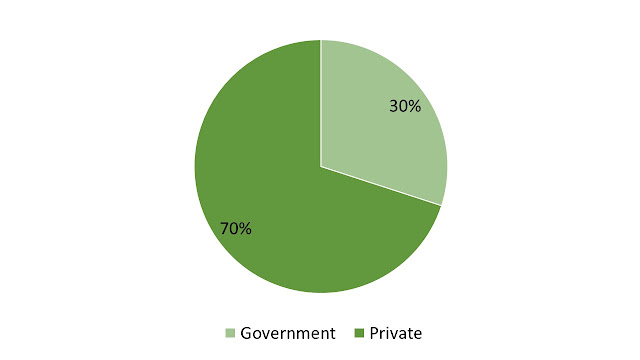
From questionnaires targeted for local residences, as shown in Figure 4.4.1, we were able to determine that 70% of them work for the private sectore while the remaining 30% work for the government sector. Another question also asked the respondents regarding which activity sector do they work in. Figure 4.4.2 shows that almost 50% of the labour forces in the Pekan Kuah is working the the tourism sector, followed by the commercial sector at 32.66%. Meanwhile, a little over 10% of the labour forces in Pekan Kuah works in the Industrial sector while the remaining 5.03% and 4.02% works in the Fishery and Agriculture sector respectively.

Meanwhile, the unemployment rate in Kedah slightly increase from 2015 to 2019 as shown by the trend line. In 2015, the unemployment rate was at 2.6%, then it increases to 2.9% in year 2016 and drop to 2.8% in year 2017 before increasing again in the year 2018 to 2.9%. The latest data shows that the unemployment rate in Kedah for the year 2019 is at 2.7%. Despite a trend showing an increase in the unemployment rate throughout the 5-year period, the decrease of unemployment rate from 2018 to 2019 gives a silver lining for 2020 unemployment rate projection. Nonetheless, with an average of 2.8% of unemployment rate for the 5 consecutive years, the unemployment rate for Kedah is relatively lower when compared to the national average for unemployment rate of 3.4%
4.5 Household Income

 |
From the Figure 4.5 , the data extracted from our questionnaires shows that a higher frequency of respondents are earning less than RM3,000 per month with a total of 46 respondents. This puts them in the category of Low-Income Group of B40 if it were based on the National Income Group Statistics in 2016. meanwhile, about 25 respondent sample that says they earn RM3,001 to RM5,000 per month can be categorized as the Middle-Income Group M40. The remaining 29 respondent from the sample survey have said they earn more than RM5,001 per month and can be considered as the High-Income Group T20. From the questionnaire, we can also point out that the highest income amount among the sample group in the T20 income group was RM13,000 per month.
Based on the analysis, it is found that the GDP per capita of the state of Kedah is increasing every year through 2015 to 2018. It is calculated that the average annual growth of Kedah GDP per capita is at 4.3% and is expected to reach RM26,360 per capita by the year 2030.
By dissecting the GDP of Kedah eve more, we area able to determine the major economic contributor of the state which is the service sector. The service sector contributes up to RM Million 25,092 in the year 2018 with a growth of 5.4% from the previous year. Based on the economic census of Kedah in the year 2016, the number of service providers establishments accounts for 88.9% of the entire economic contributor, with a total of 43.803 establishments. This is followed by sector of Manufacturing, Agriculture, Construction, Mining and Quarrying.
Tourism activity plays a huge part in the economic growth of Pekan Kuah’s regional economy. Since Langkawi is promoted as a tourism city, many local and foreign visitors come and visit the island. This surge of visitors contributes to the region’s rolling and exchange of money where it is crucial for the health of a region’s economic growth. Thus, the tourism activity also affects the supply and demand chain in the island city. According to statistics, on average the island receives about a little more than 3.5 Million visitors per year. Based on a questionnaire targeted for the tourist that had been handed out during the site visit, it is found that hotels, resorts, and homestay were at high demand to accommodate their stay here in Langkawi. Among the attraction that attracts their visit here in Langkawi are Eco-tourism, Adventure tourism, Duty-free shopping and Historical tourism. These sectors of tourism are tourist magnets and their income from the service they provide contributes to the region’s economic growth.
Meanwhile for the Labour force and employment rate in the state of Kedah, it was identified that the Labour force in the state increase throughout the year 2015 to 2019 from 905,300 to 950,000 respectively. Despite so, the unemployment rate for the state also increase slightly when a trendline is produced from the data although a slight dip also can be seen from 2018 to 2019 where the unemployment rate was at 2.9% in 2018 and 2.7% in 2019. With that said, the unemployment rate in Kedah is still reasonable when compared to the national average which is 3.4%.
In addition to that, data retrieved from a questionnaire handed out during site visit tells us that most of the labour forces in Pekan Kuah are working in the private sector accounting for 70% of the respondents out of 203 responses. Meanwhile, from the same questionnaire, we were also able to state that most labour workers work in the tourism industries, followed by the commercial industries and manufacturing industries.
6.0 ISSUES & RECOMMENDATIONS
Based on our team’s observation during our site visit, it is found that there are a lot of unused or abandoned buildings in and around Pekan Kuah. Some buildings were in good condition but no inhabitants can be found. Some buildings are done half way and were abandoned mid construction. Some buildings were old and in bad conditions. These buildings are bad for economic growth because the infrastructures were not used up to their full potential. It’s a sign of wasteful investments of money and a waste on valuable land and real estate. Such building should be occupied and used so that the flow of rolling money and exchange of money can better help in the growth of the regional economy.
One of the solutions that we have come up with is to promote cooperation between agencies and companies regardless of being private of government. A better management in infrastructure planning can ensure the success in one’s project. Integrate the supply and demand of the public with proper phase construction as well as looking at it in a regional growth context instead of individualized developers’ proposals.
Other than that, incentives should be given to those who wants to start up a business. This is to boost the occupancy rate of these vacant commercial buildings to start more economic activity in that area. Incentives should also be given to struggling business so that they can cope better with times of hardship and to prevent their business from closing down. Less shops opens means lesser economic activity.
7.0 CONCLUSION
To summarize, economy on itself is a very broad topic to discuss. Many factors and variables need to be considered before one can even phantom or grasp the idea of economy. In simple terms, an active economic sector is crucial for the healthy growth a region’s GDP. That includes the internal circulation of money within a region or an exchange of money from another region. To better manage the flow of money, sectors and many more categories were created to keep track the growth of the economy so that the right authority can predict a plan for future growth.
As the City of tourism, Langkawi island is more focus on its tourism sector when it comes to their economic income leverage and there is no sign of it diverting or shifting its focus from prioritizing tourism activity. As for the years ahead, if Langkawi were to maintain and deemed itself as a tourism city, many efforts should be done to attract more tourist for economic growth, but at the same time take care of the locals’ needs and welfare as well as the managing the health of the environment. A sense of balance should be achieved in planning for the economic growth of the island city.
8.0 REFERENCES
Reference
DRAF Laporan Analisis dan Strategi Pembangunan. (n.d.). Retrieved May 9, 2020, from Majlis Perbandaran Langkawi Bandaraya Pelancongan: http:/www.mplbpLangkawi.gov.my
eDataBank . (n.d.). Retrieved May 10, 2020, from Department of Statistics Malaysia Official Portal: https://www.dosm.gov.my/v1/index.php
Rancangan Tempatan Daerah (RTD). (n.d.). Retrieved May 8, 2020, from Majlis Perbandaran Langkawi Bandaraya Pelancongan: http:www.mplbpLangkawi.gov.my
No comments:
Post a Comment